
The rooftop opportunity
Why I’m still bullish on residential solar
The UK case in 2026: more installations, a substantial rooftop opportunity, and household savings that need honest arithmetic.
Three findings from the data
-
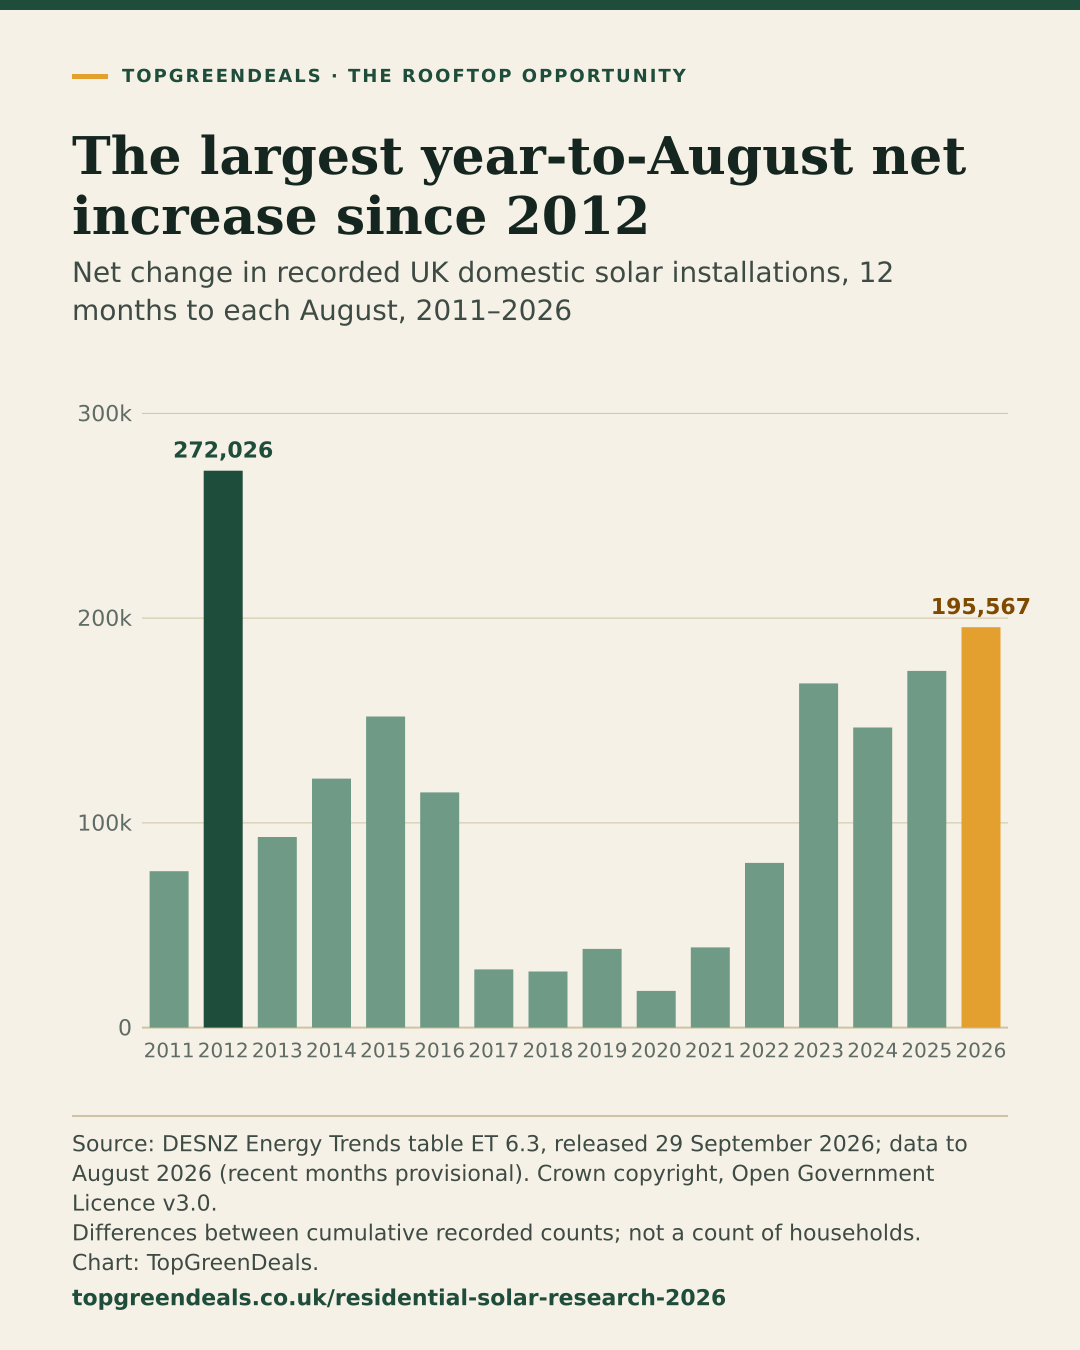
+195,567
Net increase in recorded domestic solar installations in the 12 months to August 2026 (up 12.5%): the largest for any year to August since 2012.
See every year since 2011 -
30.5%
Share of the UK’s recorded solar capacity that is domestic: 7.09 GW of 23.2 GW in August 2026. Solar farms and commercial systems make up the rest.
Read the deployment figures -
278–8,131
Recorded installations per constituency, from Bethnal Green and Stepney to Ceredigion Preseli. These are raw counts, not adjusted for population or housing stock.
Find your constituency
Cite or reuse this report
Kuznetsov, I. (2026) ‘Why I’m still bullish on residential solar’, TopGreenDeals special report, 23 October 2026. Data: DESNZ Energy Trends table ET 6.3, released 29 September 2026, data to August 2026. https://topgreendeals.co.uk/residential-solar-research-2026 (accessed 27 October 2026).
DESNZ data: Crown copyright, reused under the Open Government Licence v3.0. Credit DESNZ for the statistics and TopGreenDeals for the calculations and charts. Downloads and chart images
Edition 1: DESNZ release of 29 September 2026, data to August 2026. Edition and changes
I wrote the first version of this argument in July 2025. I still believe Britain should make much more use of its roofs. Solar can appeal to people who disagree about almost everything else: it produces lower-carbon electricity, gives households more control over their energy spending, and uses space that is already built on.
But a good case does not need exaggerated numbers. Updating the article meant correcting some of the earlier calculations and claims, not simply changing the year in the title.
The case I would make today is this: rooftop solar deserves consistent support, but it is not a substitute for the grid, and a battery is not automatically a good investment for every home.
I run TopGreenDeals, which helps people find and compare UK green-energy installers. This is my view, supported by the evidence and calculations below.
What has changed since last year?
The latest available DESNZ solar deployment release, published on 29 September 2026, covers August 2026. It records:
| Measure | August 2026 |
|---|---|
| Total UK solar capacity, including solar farms and commercial systems | 23.2 GW |
| Capacity recorded as domestic solar | 7.09 GW |
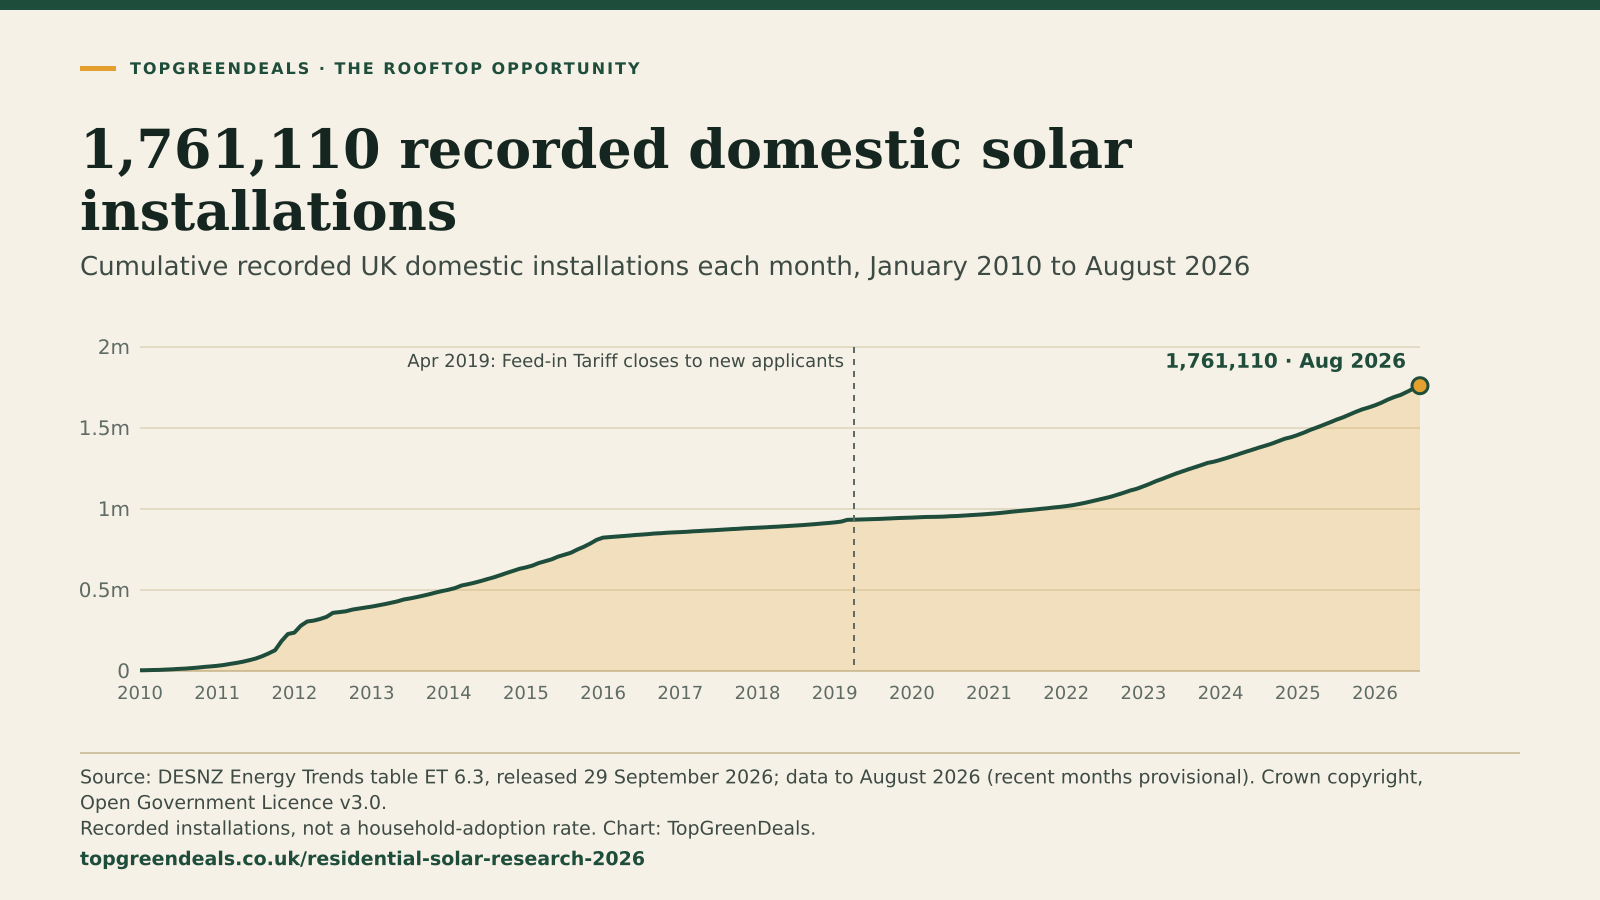
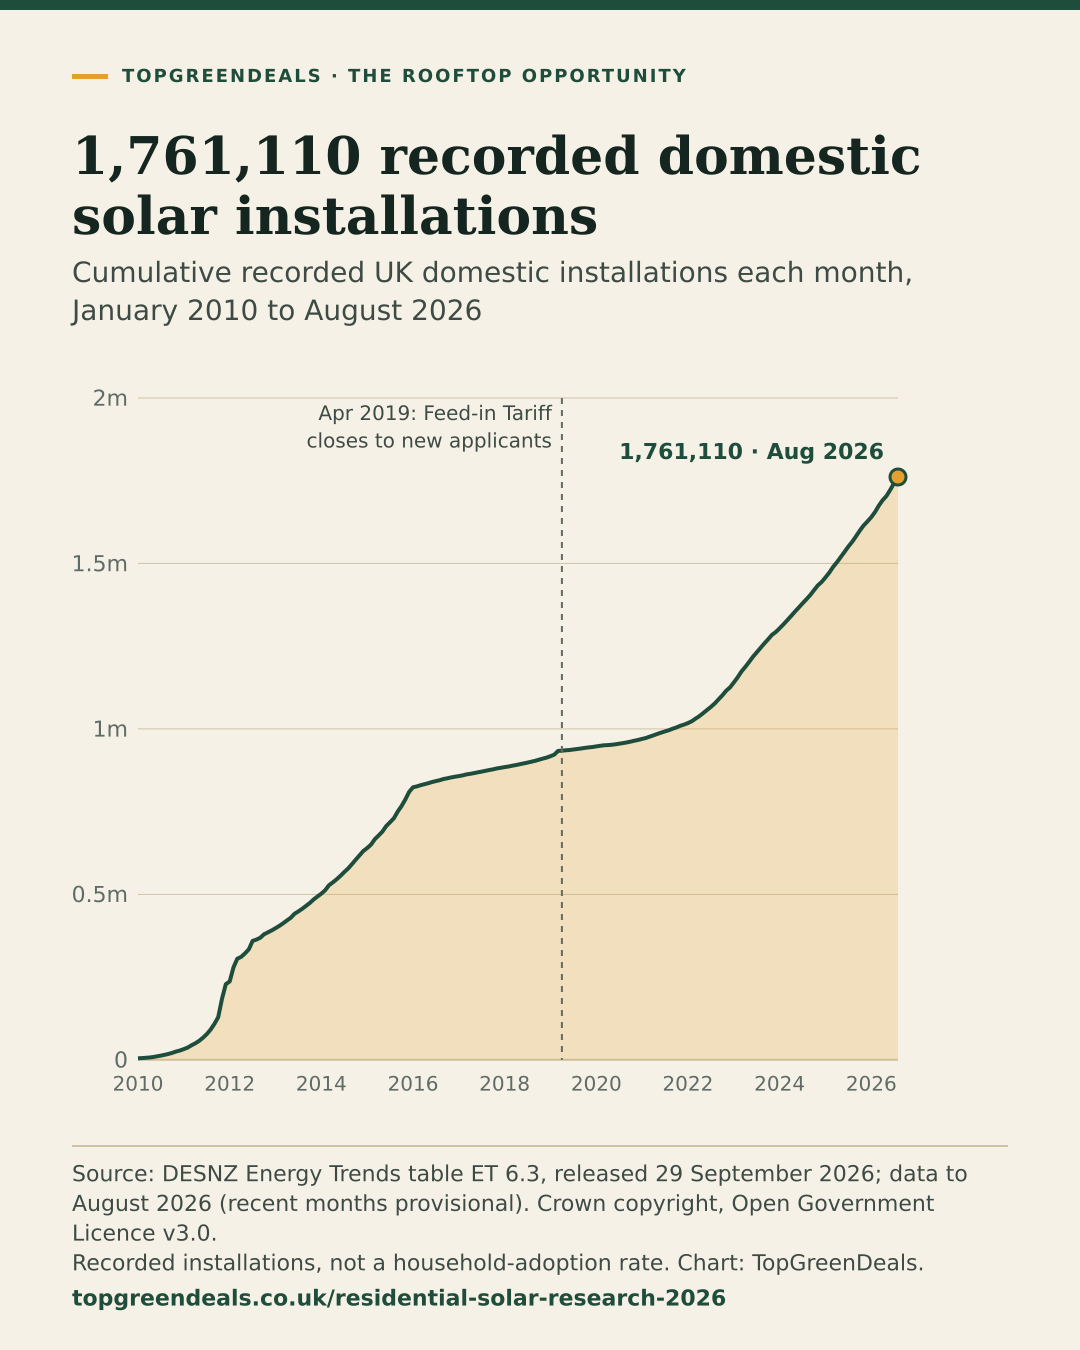
| Recorded domestic installations | 1,761,110 |
| Additional recorded domestic installations since August 2025 | 195,567 |
That is a 12.5% increase in recorded domestic installations in a year. Domestic solar accounts for roughly 30% of total UK solar capacity. These are provisional statistics, not a count of every solar-equipped household: the dataset has coverage limitations, and installations should not be treated as a household-adoption rate.
The growth story
The largest year-to-August increase since 2012
Recorded domestic installations rose by a net 195,567 in the 12 months to August 2026. Only the year to August 2012 (272,026) saw a larger net increase. Switch to the cumulative views for every month since 2010.
12 months to August 2026 +195,567 net change in recorded domestic installations From 1,565,543 to 1,761,110, up 12.5%
Tap or drag across the chart, or use the slider and arrow keys, to read any point.
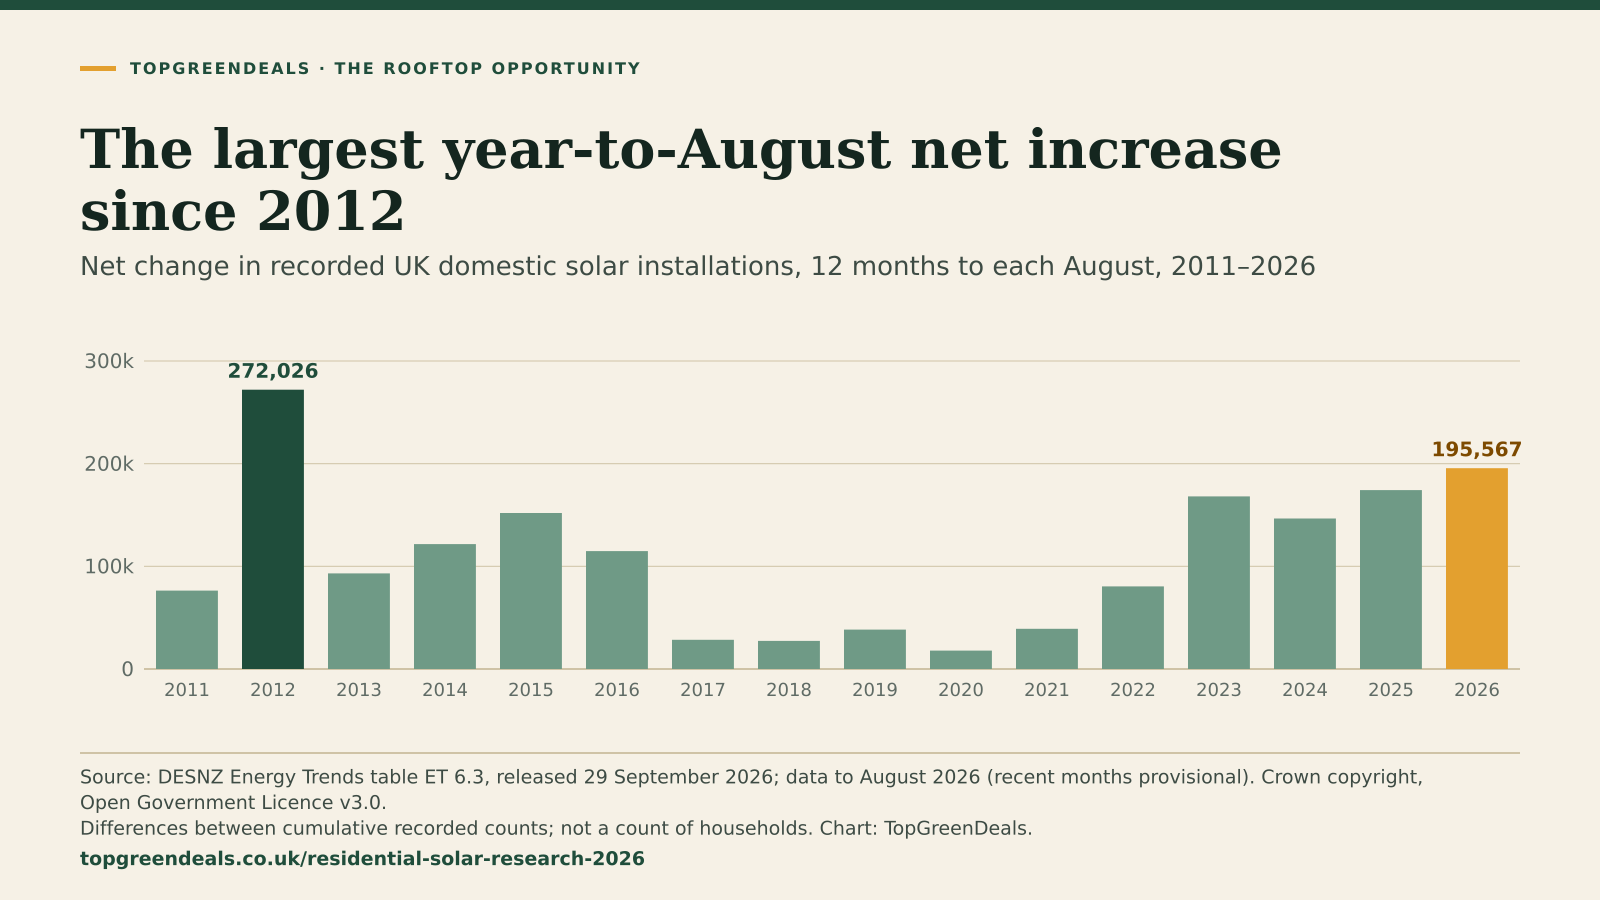
Every August, 2010 to 2026: the data behind all three views
| Month | Domestic capacity (GW) | Recorded installations | Net change in 12 months |
|---|---|---|---|
| August 2010 | 0.04 | 14,976 | Series starts January 2010 |
| August 2011 | 0.25 | 91,361 | +76,385 |
| August 2012 | 1.17 | 363,387 | +272,026 |
| August 2013 | 1.50 | 456,464 | +93,077 |
| August 2014 | 1.96 | 578,104 | +121,640 |
| August 2015 | 2.51 | 730,041 | +151,937 |
| August 2016 | 2.94 | 844,899 | +114,858 |
| August 2017 | 3.03 | 873,316 | +28,417 |
| August 2018 | 3.12 | 900,728 | +27,412 |
| August 2019 | 3.27 | 939,144 | +38,416 |
| August 2020 | 3.34 | 957,057 | +17,913 |
| August 2021 | 3.48 | 996,210 | +39,153 |
| August 2022 | 3.81 | 1,076,678 | +80,468 |
| August 2023 | 4.59 | 1,244,777 | +168,099 |
| August 2024 | 5.27 | 1,391,337 | +146,560 |
| August 2025 | 6.08 | 1,565,543 | +174,206 |
| August 2026 | 7.09 | 1,761,110 | +195,567 |
Solar also retains broad public support. In the Spring 2026 DESNZ Public Attitudes Tracker, 84% supported solar energy and 4% opposed it. That is support for the technology generally—not proof that everyone wants panels on their own roof or supports every local development.
A sunny annual total is not the same as an independent home
Solar panels generate electricity from daylight, including in cloudy conditions, but output changes with the season, location, roof direction and shading. Winter production is much lower than summer production.
Two measures are often confused:
- Self-consumption: how much of the solar electricity you generate is used in your home rather than exported.
- Self-sufficiency: how much of your home’s electricity demand is met by that solar electricity.
They have different denominators. A home can generate more electricity over a year than it consumes and still buy electricity from the grid on most winter evenings. A normal home battery moves energy between hours; it does not store a summer’s surplus for winter.
The old article also used Ofgem’s 2,700 kWh benchmark as though it described an average single-family home. Ofgem’s updated decision lowered the medium-use benchmark for single-rate electricity meters to 2,500 kWh a year from 1 July 2026. It is a comparison benchmark, not a prediction for your property. Use your own annual consumption, especially if you have an electric vehicle or heat pump.
What does residential solar actually cost?
The government’s May 2026 solar cost release covers installations from April 2025 to March 2026. It gives useful context, but the definitions matter.
On a total installed capacity basis, the mean domestic installed cost was approximately £1,955 per kW for the 0–4 kW band and £1,645 per kW for the 4–10 kW band. These Great Britain figures include generation equipment, installation, connection and applicable VAT, but exclude batteries and other additional devices.
The often-quoted £1,595 per kW figure is the median across domestic and non-domestic installations in the smaller band. It is not a domestic-only average. Nor should the new total-installed-capacity series be compared casually with older declared-net-capacity figures: the government warns that changing the capacity measure changes the cost per kW.
For an existing home, the roof, access, scaffolding, electrical work and equipment choice still determine the quote. Get an itemised price and a generation estimate for your actual roof. Our solar costs guide explains the main items to compare.
A worked example—with the assumptions visible
Here is an illustration, not a promise of savings or a measured household. Assume:
- A 4 kWp array generating 3,600 kWh a year: an assumed yield of 900 kWh per kWp, not a UK-wide guaranteed output.
- Household electricity use of 3,500 kWh a year.
- 1,080 kWh of solar used directly in the home, with the remaining 2,520 kWh exported.
- An import price of 26.32p/kWh, the Ofgem October–December 2026 Direct Debit average for Great Britain.
- An assumed solar-only installation quote of £7,000.
| Annual value | At an assumed 5p export rate | At an assumed 15p export rate |
|---|---|---|
| Electricity purchases avoided | £284 | £284 |
| Export income | £126 | £378 |
| Combined annual benefit | £410 | £662 |
| Simple payback on the assumed £7,000 quote | 17.1 years | 10.6 years |
The formula is straightforward: solar electricity used at home × avoided import price, plus exported electricity × export price. Export income is not an extra saving to add again to that total.
The 5p and 15p rates are comparison assumptions, not universal offers. SEG suppliers set their own rates and eligibility terms; compare the complete import/export arrangement. Standing charges remain payable. This simple payback holds prices and output constant and excludes finance, maintenance, replacements and degradation, so it is not a lifetime investment return.
A battery changes both sides of the calculation
Suppose a battery diverts an additional 1,000 kWh a year from export and returns 900 kWh to the home after losses. The extra avoided purchases are worth about £237 at the same import price. But the household gives up export income on the full 1,000 kWh:
- At a 5p export rate, the additional annual value is about £187.
- At a 15p export rate, it is about £87.
Those figures are before the battery’s purchase, finance and replacement costs. This is an annual-flow illustration, not a battery-sizing or hourly-dispatch model. Cheap overnight charging, time-varying tariffs and flexibility payments can change the result, but they must be modelled separately rather than assumed.
A household’s solar balance
The worked example, drawn to scale
The same assumptions as above: a 4 kWp array generating 3,600 kWh a year, a home using 3,500 kWh, and electricity bought at 26.32p/kWh.
Energy over a year kWh
Annual value £ a year
The battery’s trade-off at 5p + £236.88 of purchases avoided: 900 kWh returned × 26.32p − £50.00 of export income given up: 1,000 kWh not exported × 5p = £186.88 a year, before the battery’s purchase, finance and replacement costs
Combined annual value £410.26
Simple payback on the assumed £7,000 solar-only quote: 17.1 years.
I remain positive about batteries. I just want the quote to show what the battery adds—not give it credit for savings the panels would already produce. Compare your own scenarios with our solar calculator and home battery guide.
What could another million solar roofs contribute?
There is a meaningful national opportunity without assuming every roof is suitable. Rather than repeat an uncertain estimate of Britain’s entire rooftop potential, here is a calculation anyone can check.
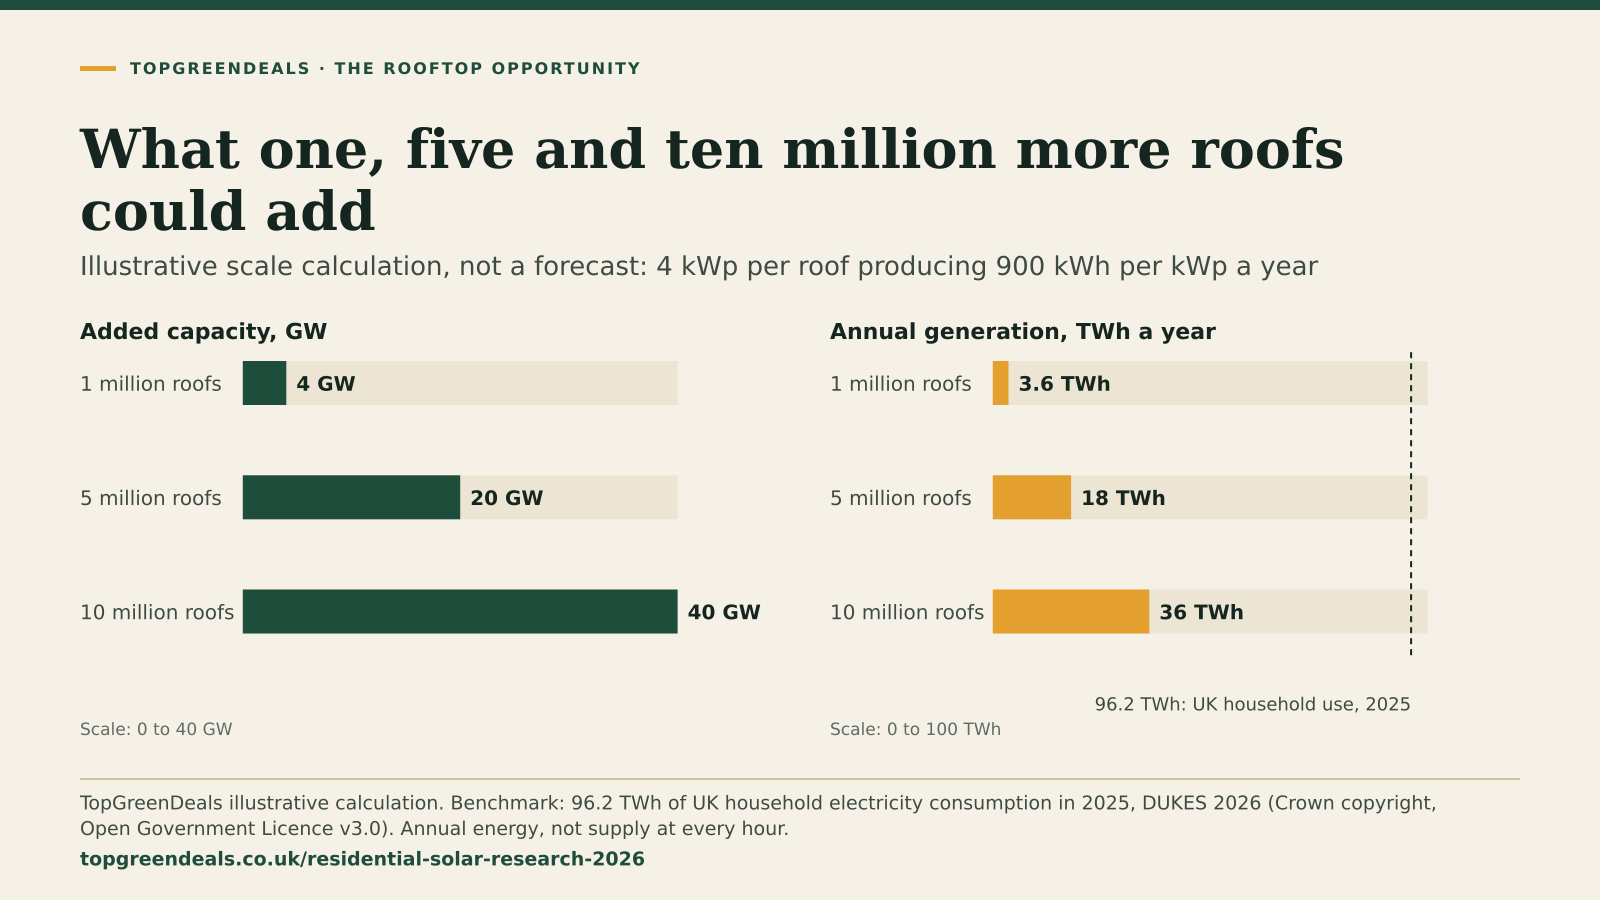
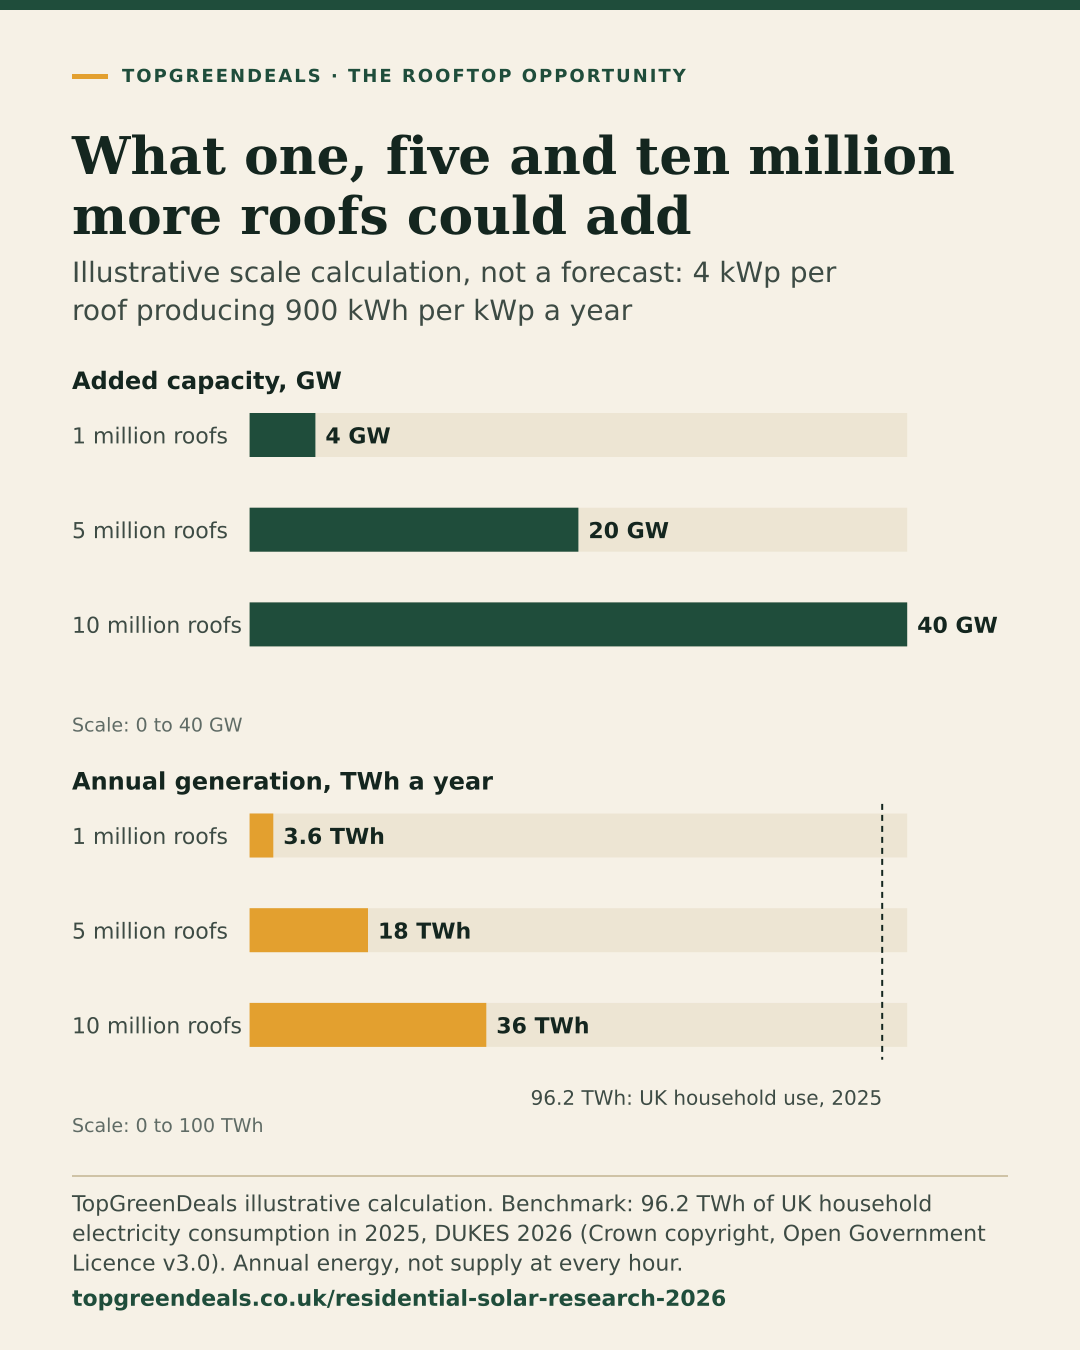
Assume each additional suitable roof receives 4 kWp, producing 900 kWh per kWp a year. One million roofs would add 4 GW of capacity and 3.6 TWh of annual generation.
For context, DUKES 2026 reports 96.2 TWh of UK household electricity consumption and 323.0 TWh of total UK electricity demand in 2025. Total demand includes uses and losses outside final household consumption.
The scale of roofs
One, five and ten million more roofs
Illustrative only: not a forecast, and not a finding that this many suitable roofs exist. Each roof is assumed to carry 4 kWp producing 900 kWh per kWp a year.
Added capacity GW
- 1 million roofs 4 GW
- 5 million roofs 20 GW
- 10 million roofs 40 GW
Annual generation TWh a year
- 1 million roofs 3.6 TWh
- 5 million roofs 18 TWh
- 10 million roofs 36 TWh
| Additional roofs assumed | Added capacity | Annual generation assumed | Equivalent share of 2025 household electricity consumption | Equivalent share of 2025 total electricity demand |
|---|---|---|---|---|
| 1 million | 4 GW | 3.6 TWh | 3.7% | 1.1% |
| 5 million | 20 GW | 18 TWh | 18.7% | 5.6% |
| 10 million | 40 GW | 36 TWh | 37.4% | 11.1% |
These are scale illustrations, not forecasts or findings that this many additional suitable roofs exist. The percentages compare annual energy, not supply at every hour. They do not account for future demand growth, curtailment, storage losses or the grid investment needed to integrate more generation.
Even the one-million-roof example is a substantial contribution. I do not need to claim that residential solar can replace most national electricity supply to think it is worth pursuing.
Support did not disappear in 2024
My original wording on incentives was wrong. The Feed-in Tariff closed to new applicants from 1 April 2019, not 2024. Existing eligible participants continue receiving payments under their scheme terms.
Support has changed rather than vanished:
- The Smart Export Guarantee, launched in 2020, pays eligible small generators in Great Britain for metered exports. It does not provide the old Feed-in Tariff’s generation payment.
- Qualifying installed solar panels and electrical battery storage currently receive zero-rated VAT. Under the published rules, the relief runs to 31 March 2027, with a 5% rate scheduled afterwards. Equipment bought without qualifying installation is treated differently.
- The Warm Homes Plan sets out £15 billion of public investment, including support for low-income households and an intended low- and zero-interest finance offer for technologies such as solar and batteries. That is a programme commitment, not a £15 billion solar-only fund or an immediately available grant for every household. Eligibility and delivery differ by scheme and nation.
The policy question has moved on from simply bringing back the old tariff. I would judge support by whether it helps households get a well-designed system at a fair price, including people who cannot pay the upfront cost themselves.
Roofs and solar farms are not an either/or choice
Using an existing roof avoids taking additional land for that installation. Many domestic systems can also use permitted development rights. But planning exemptions have limits and conditions, and rules differ across the UK. Listed buildings, designated areas, roof suitability, building regulations and network-connection requirements still matter.
I would not repeat the earlier claim that residential solar is universally 20–30% cheaper for society than solar farms. A household saving the retail price of electricity is not the same calculation as the system-wide cost of producing a kilowatt-hour. Comparing a farm’s total capital cost with a household subsidy also leaves out the household’s own spending.
The government’s Solar Roadmap makes the case for solar at several scales and explicitly addresses network constraints and connection reform. Rooftop solar can reduce imports at the time it generates; a suitably controlled battery can move some energy into higher-demand hours. Neither removes the need to maintain and expand the network. Large amounts of local export can create constraints too.
That is why I have removed the earlier unsourced transformer-age claim and the blanket prediction that household solar would cut peak demand by 20–30%. Those are not necessary to make the case for roofs.
What I would like to see next
My priorities are practical: predictable support rather than stop-start incentives; finance that does not swallow the savings; routes for tenants and lower-income households to benefit; straightforward network connections; and clear standards for quotes, installation and aftercare.
For an individual household, I would start with the roof and the electricity bill, compare solar with and without a battery, and ask the installer to show the assumptions. For government, I would treat rooftops as a serious part of infrastructure policy alongside solar farms, wind, storage and the grid.
That is why I am still bullish. We already have a growing base of domestic installations, unused roof space and a technology households can put to work. The opportunity is substantial enough to stand on accurate numbers.
Use the figures
Find your constituency
Recorded domestic solar in all 650 constituencies
Recorded domestic installations and their capacity in August 2026, by 2024 Westminster constituency. Counts are not a share of homes: constituencies differ in population and housing stock, and recent months are provisional.
Selected · South West
North Cornwall
- Recorded domestic installations
- 7,098
- Ranked 4 of 650 by recorded installations
- Installed domestic capacity
- 32.718 MW
- 4.6 kW per recorded installation, on average
- Within its nation or region
- 1 of 58
- in the South West region; its median is 4,104.5
2.9 times the UK median constituency’s 2,472.5 recorded installations.
Cite this figure
North Cornwall had 7,098 recorded domestic solar installations (32.718 MW) in August 2026, ranked 4 of 650 UK parliamentary constituencies and 1 of 58 in the South West region. Source: DESNZ Energy Trends table ET 6.3, released 29 September 2026, via TopGreenDeals: https://topgreendeals.co.uk/residential-solar-research-2026?constituency=E14001385#find-your-area (accessed 27 October 2026).
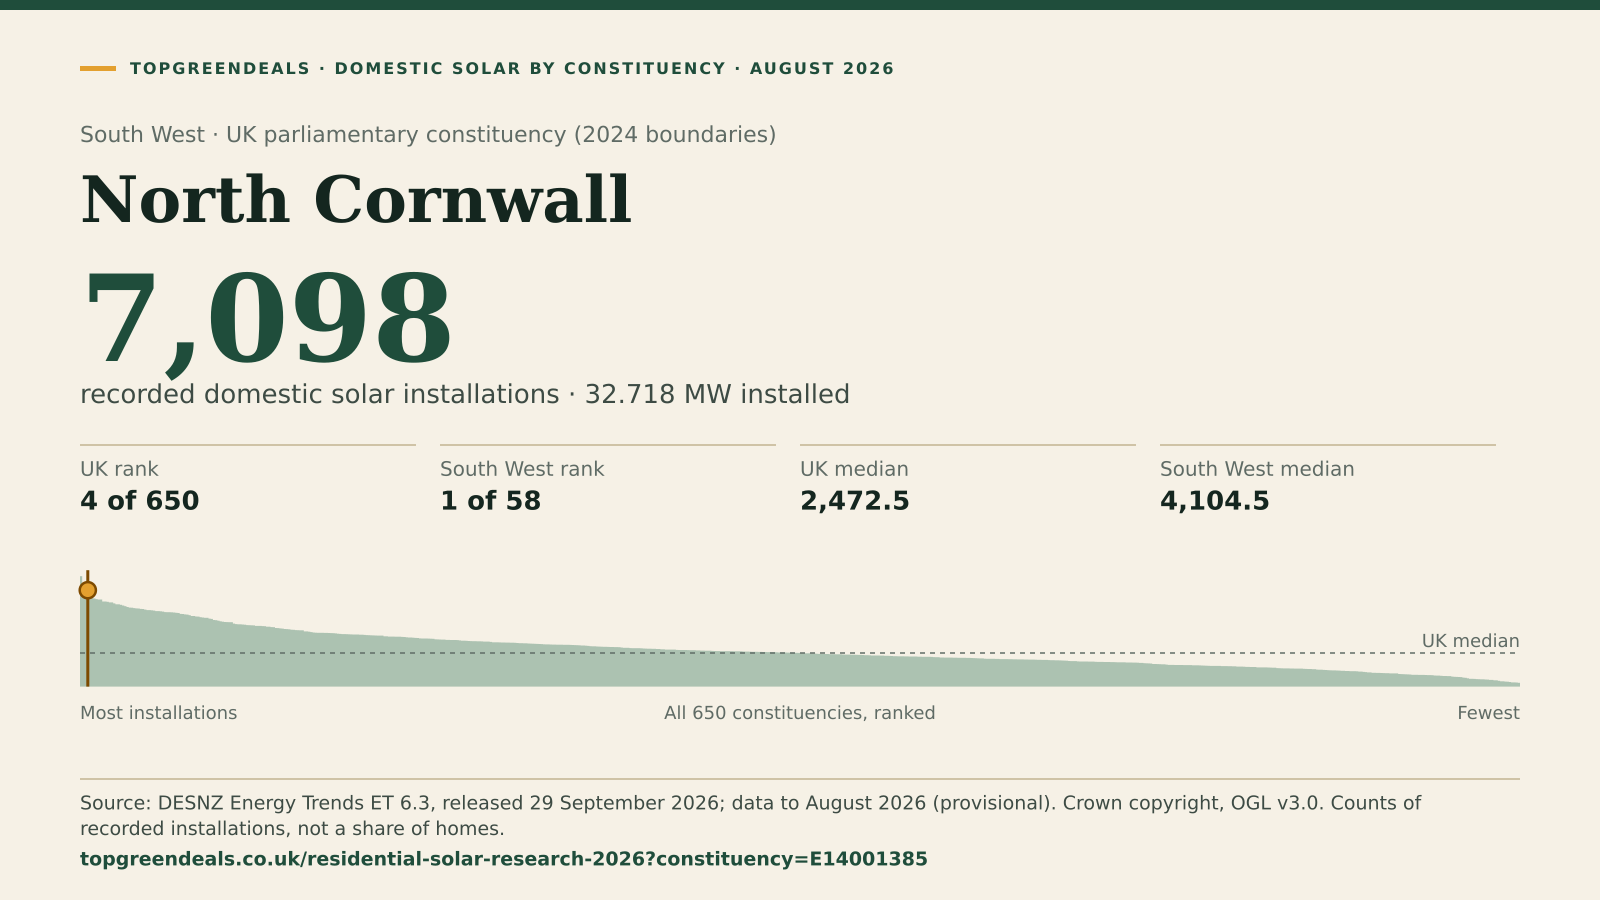
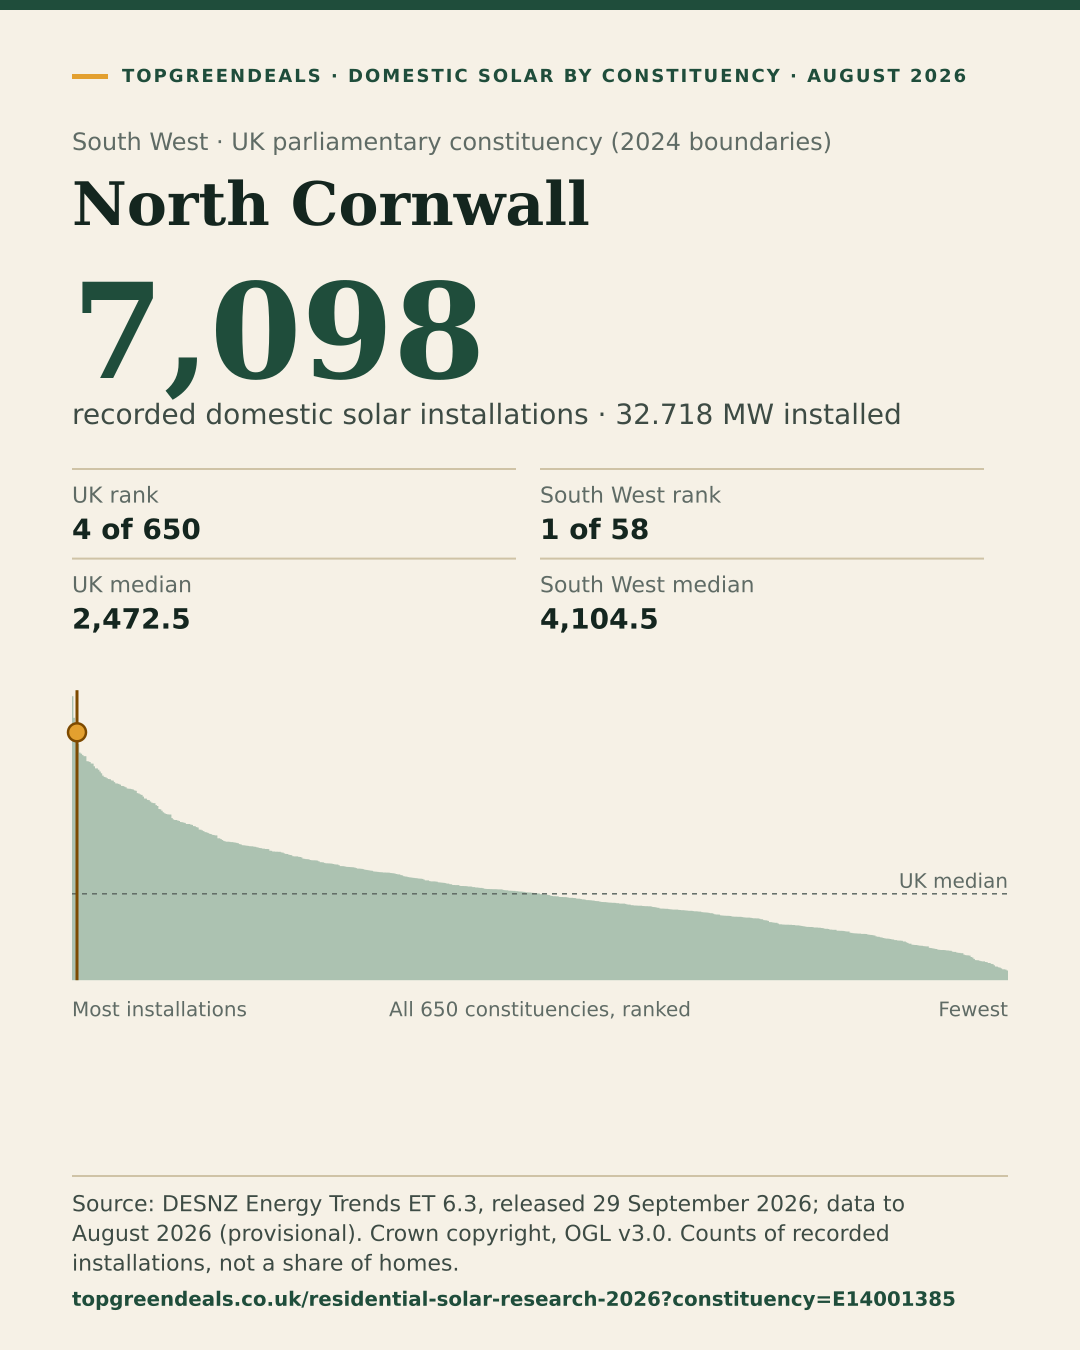
All 650 constituencies, August 2026
- Recorded installations allocated to constituencies
- 1,756,076
- Plus 5,034 that could not be allocated
- Median constituency
- 2,472.5
- recorded installations: the midpoint of the 325th and 326th constituencies
Most installations
- 1 Ceredigion Preseli 8,131
- 2 Peterborough 7,513
- 3 South Cambridgeshire 7,123
- 4 North Cornwall 7,098
- 5 Montgomeryshire and Glyndwr 6,768
Fewest installations
- 650 Bethnal Green and Stepney 278
- 649 Kensington and Bayswater 303
- 648 Poplar and Limehouse 311
- 647 Bermondsey and Old Southwark 313
- 646 Chelsea and Fulham 337
Source: DESNZ Energy Trends table ET 6.3, September 2026 release, domestic installations by 2024 parliamentary constituency. Every row is in the constituency CSV.
The deployment figures are a dated extract of DESNZ ET 6.3, released on 29 September 2026 with data through August 2026. They are not a new survey by TopGreenDeals. The household and additional-roof tables are our own illustrative calculations using the assumptions printed above.
Downloads
-
Domestic solar by parliamentary constituency, August 2026 (CSV)
Counts are not adjusted for population or housing stock; 5,034 recorded installations could not be allocated to a constituency and are excluded from the constituency rows.
Columns
constituency_code- ONS 2024 constituency code
country_or_region- nation or English region
constituency- constituency name
installed_capacity_mw- recorded domestic capacity, MW
recorded_domestic_installations- recorded domestic installations
period- data month
source_url- DESNZ workbook
-
Monthly UK solar series, January 2010 to August 2026 (CSV)
Recent months are provisional and may be revised by DESNZ.
Columns
period_label- month
all_solar_capacity_mw- all UK solar capacity, MW
domestic_solar_capacity_mw- recorded domestic capacity, MW
recorded_domestic_installations- cumulative recorded domestic installations
source_url- DESNZ workbook
-
Additional-roof calculations (CSV)
TopGreenDeals illustrative calculations; not a forecast.
Columns
additional_roofs_assumed- roofs assumed
kwp_per_roof_assumed- kWp per roof
annual_kwh_per_kwp_assumed- yield, kWh per kWp
capacity_gw- added capacity, GW
annual_generation_twh- annual generation, TWh
percent_of_2025_uk_domestic_consumption_96_2_twh- % of 96.2 TWh household use
percent_of_2025_uk_total_demand_323_twh- % of 323 TWh total demand
interpretation- how to read the row
-
Household savings calculations (CSV)
TopGreenDeals illustrative calculations for the worked example; not a measured home.
Columns
case- solar only or with the battery example
annual_generation_kwh_assumed- generation, kWh
annual_household_demand_kwh_assumed- demand, kWh
direct_solar_used_kwh_assumed- solar used as generated, kWh
battery_input_kwh_assumed- into the battery, kWh
battery_output_kwh_assumed- out of the battery, kWh
solar_exported_kwh- exported, kWh
import_rate_gbp_per_kwh- import price, £/kWh
export_rate_gbp_per_kwh_assumed- export rate, £/kWh
avoided_import_value_gbp- purchases avoided, £
export_income_gbp- export income, £
annual_combined_value_gbp- combined, £
simple_solar_only_payback_years_at_7000_gbp_assumed- simple payback, years
interpretation- how to read the row
-
August 2025 and August 2026 comparison chart (SVG)
The two-bar chart published with the first version of this report: 1,565,543 and 1,761,110 recorded installations.
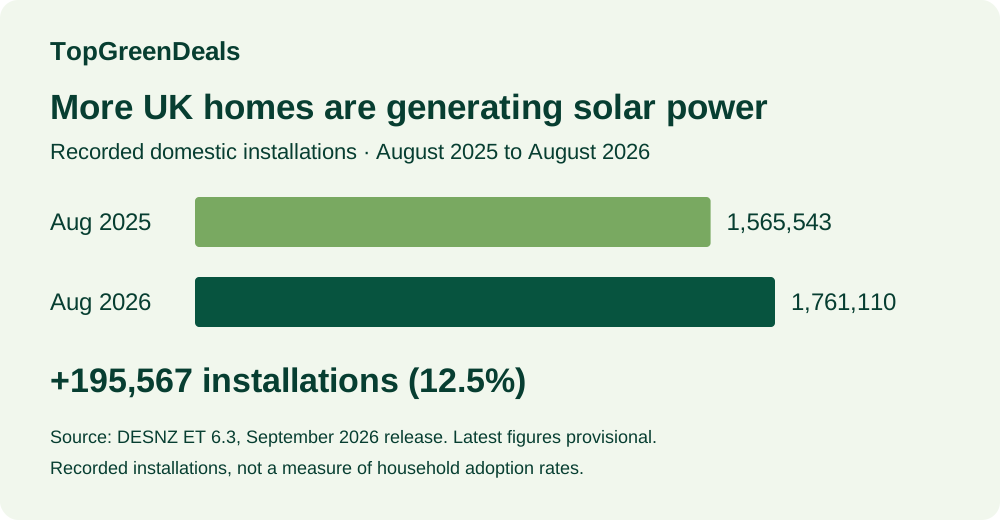
Chart images
Each image carries its source, data date and this report’s address. Constituency cards are in the explorer above.
- Net change in each year to August, 2011–2026 Landscape, 1600 × 900 PNG Portrait, 1080 × 1350 PNG
- Cumulative recorded installations, 2010–2026 Landscape, 1600 × 900 PNG Portrait, 1080 × 1350 PNG
- One, five and ten million more roofs (illustrative) Landscape, 1600 × 900 PNG Portrait, 1080 × 1350 PNG
DESNZ data: Crown copyright, reused under the Open Government Licence v3.0. Please credit DESNZ for the underlying statistics and TopGreenDeals for the calculations and chart. Reuse does not imply government endorsement. Publication and data dates are stated so readers can check for later revisions.